The end-user experience monitoring market is chock-full of options that can be confusing to keep track of. Take a look at nine EUEM tools IT professionals should know about.
Many vendors now offer end-user experience monitoring tools to measure physical and virtual desktop performance from the users' perspective, but it can be difficult to know what functionality these products actually provide and how monitoring fits in.
Once deployed, end-user experience monitoring (EUEM) tools can be extremely valuable, but finding the right product can be a challenging process. There is plenty of confusing product information and insufficient support documentation across the market. Even the actual product names can be unclear. To implement the best EUEM strategy for end users, organizations should understand the concepts that it can encompass and how that can vary from platform to platform.
Navigating the end-user experience monitoring market
EUEM functionality is often incorporated into more comprehensive platforms, so IT administrators must dig into each one to see if and how it might implement EUEM. For example, some platforms bill themselves as application performance monitoring (APM) providers, which might seem unrelated to EUEM, but many of these products include extensive EUEM capabilities.
The terminology surrounding EUEM can also be confusing. Some resources, for instance, use the terms end-user experience monitoring and digital experience monitoring (DEM) interchangeably, while other resources define DEM as a combination of APM and EUEM. Other terms that vendors might use include digital experience management, rather than monitoring, and digital employee experience (DEX), which is similar to DEM, except that the product focuses on end users who are employees.
Another source of confusion is real user monitoring (RUM), a passive monitoring technique that collects data from real users' sessions. This approach is a subset of EUEM, although some resources use the terms interchangeably.
Some resources, for instance, use the terms end-user experience monitoring and digital experience monitoring (DEM) interchangeably, while other resources define DEM as a combination of APM and EUEM.
RUM is often contrasted with synthetic monitoring, another type of monitoring and subset of EUEM. Synthetic monitoring takes an active approach, gathering performance metrics by simulating real user interactions with an application. If a vendor offers synthetic monitoring, it is generally included along with real user monitoring as part of a larger EUEM or DEM package.
9 end-user experience monitoring tools to consider
Given the range of concepts and features involved in end-user experience monitoring, it's important to understand how vendors use these different terms and what it is they're actually selling. Explore nine end-user experience monitoring tools to help clarify what vendors are offering and how EUEM fits into each platform.
Cisco AppDynamics
AppDynamics is a full-stack observability platform that correlates performance with key business metrics to identify and resolve performance issues. It automatically tracks the flow of traffic requests while providing business transaction monitoring, anomaly detection, root cause diagnostics and full-stack analytics. AppDynamics also combines application and security monitoring, which enables IT to quickly identify vulnerabilities and resolve issues while breaking down silos between ops teams and security teams.
The platform provides an end-user monitoring component that tracks key metrics across devices, browsers and third-party services to capture data about errors, crashes, network requests and other events. The end-user monitoring feature includes the following components:
Experience journey mapping. Charts the most trafficked application paths, evaluates their performance and provides an aggregated view of all sessions across an application, helping to visualize how users interact with the application.
Mobile RUM. Provides detailed session analytics that show how users interact with their mobile apps by tracking the entire end-to-end user interaction, from the gesture level all the way down to the code level.
Browser RUM. Tracks end-to-end user activity for web-based applications during user sessions.
Browser synthetic monitoring. Tracks business transactions by using cloud-based synthetic agents that monitor activity from the browser to the back end to simulate a user's entire interaction with the application.
IoT monitoring. Provides insights into device and user behavior through the use of AppDynamics' Cognition Engine, which incorporates machine learning algorithms that analyze transaction-based performance data.
These components work in conjunction with other AppDynamics features to provide a complete application monitoring product in which EUEM plays a pivotal role.
ControlUp DEX
ControlUp's digital employee experience management platform provides real-time monitoring of physical endpoints, virtual desktops, and SaaS and web applications. It offers end-to-end visibility into servers and desktops, as well as users and applications, which enables IT to identify and troubleshoot performance bottlenecks. The ControlUp DEX platform consists of three main products:
ControlUp Real-Time DX. Gathers data about the end-user experience. IT admins can perform real-time monitoring through dashboards that make it possible to pinpoint and proactively fix problems. Through the Solve user interface, they can see the entire environment and search and group resources. In addition, they can use the metrics to find root causes and remediate issues such as excessive logon durations or slow application responses. Admins can also set up custom alerts to meet their specific circumstances.
ControlUp Edge DX. Focuses on the digital employee experience on Windows, macOS and Linux endpoints, no matter where users are working. The product captures real-time data and generates detailed reports about devices and user experience. It can also send alerts to administrators, who can then control the endpoints remotely to fix issues.
ControlUp Scoutbees. Uses continuous synthetic monitoring to track the availability of applications, desktops and network resources, including virtual applications and desktops. With this cloud-based tool, administrators can quickly identify and address availability issues.
ControlUp also provides free utilities for DEX management. For example, administrators can use the NetScaler add-on to monitor NetScaler environments, or they can use the IGEL integration pack to manage IGEL devices. Another available offering is the application profiler, which measures, analyzes and benchmarks application load times.
Datadog
Datadog is a monitoring and security platform that enables IT and DevOps teams to see inside their application stacks, even at scale. With over 600 built-in integrations, Datadog aggregates metrics and events across a wide range of systems, applications and services. Organizations can trace requests across distributed systems and monitor their code using open source tracing libraries.
Datadog provides auto-generated service overviews to track application performance, along with graphs and alerts based on error rates or latency percentiles. Admins can search, filter and analyze logs, and navigate between logs, metrics and request traces. The platform also offers end-to-end user experience visibility through the following digital experience features:
RUM. Provides insights into an application's performance from the user's perspective, with the data correlated to logs, traces, back-end metrics, synthetic tests and network performance data.
Synthetic monitoring. Supports code-free tests that simulate user transactions against applications while enabling administrators to monitor network endpoints across layers.
Continuous testing. Provides a set of tools that enable API teams to automate software testing for an application's entire lifecycle.
Session replay. Enables organizations to capture and replay their users' web browsing experience, making it easier to identify and fix usability issues.
Error tracking. Provides a logical framework for troubleshooting application errors, assessing their impact and resolving issues quickly.
The platform enables administrators to build real-time interactive dashboards with high-resolution metrics and events that can be manipulated and graphed in real time. Administrators can also set up complex alerting logic so they're notified in the event of a performance issue, whether on a single host or across a massive cluster. Datadog provides API access for third-party applications as well.
Dynatrace
Dynatrace is a software intelligence platform that provides end-to-end observability, regardless of scale. The platform includes infrastructure monitoring, APM, DEM, application security, business analytics and cloud automation. IT teams can use AI-powered analytics to predict and resolve issues before they impact users, as the platform provides a view of their environment that includes logs, metrics and traces. This feature also includes a full topological model that incorporates code-level detail, entity relationships, and behavioral and user experience data.
The Digital Experience module is one of the key components of the Dynatrace platform. It ensures that each monitored application is functional and available. This includes web, mobile and IoT applications. The module contains the following functions to help optimize the user experience:
Grail analytics. Provides insights into monitored applications with AI-powered analytics. Grail, which is built on a massively parallel processing data lakehouse specifically for Dynatrace analytics, acts as a unified back end for observability.
RUM. Tracks user sessions in real time across all digital transactions and allows IT to replay individual transactions to identify issues and their root causes. IT teams can capture how users experience every transaction across web, mobile and customer apps while gauging user satisfaction and the real-time business impact.
Synthetic monitoring. Uses a web-based recorder to capture business transactions, benchmark site performance and compare web application performance from an end-user perspective.
Mobile monitoring. Tracks mobile application performance in real time for individual components throughout the application stack and shows information about application interdependencies. Administrators can also view mobile crash analytics that provide AI-powered root cause diagnostics.
In addition to Grail, the Dynatrace platform incorporates several other core technologies that work together to help IT teams understand their environments more easily. For example, OneAgent is a single-agent technology that IT can deploy to monitored hosts. Administrators need to deploy the agent only once, and it will start collecting relevant metrics almost instantly. Dynatrace also includes PurePath, a distributed tracing and code-level analysis technology, as well as Smartscape, a topology mapping technology.
EG Innovations EG Enterprise
EG Enterprise is a cloud-based application and IT infrastructure monitoring platform that supports on-premises and cloud-hosted applications -- including deployments in mobile, hybrid cloud and virtualized environments. The platform offers a set of tools to monitor both modern and legacy applications, as well as tools to detect, diagnose and resolve application issues, all from a centralized interface.
It also includes tools that are specific to DEM. The platform provides built-in user experience metrics, along with proactive alerting and actionable insights. Other useful features in EG Enterprise include the following:
EG Universal Monitor. Lets admins view information about applications, OSes, storage devices and virtualized environments.
RUM. Passively monitors systems in real time using an Agentless approach that captures and analyzes every user transaction.
Synthetic transaction monitoring. Actively monitors systems by emulating transactions and capturing user-experience measurements proactively.
Administrators can use a combination of agent-based and agentless monitoring in their environments. They can also simulate client sessions, which can be recorded and played back, and multi-step, session-oriented user interactions with web applications.
The platform automatically correlates performance across infrastructure, and it establishes baselines for the collected metrics through machine learning. This simplifies the process of reviewing the metrics while preemptively addressing potential issues.
Nexthink Infinity
Nexthink launched Infinity, a cloud-based analytics, automation and remediation platform, in 2022. The platform uses machine learning and benchmarking to enable IT teams to diagnose issues, automatically find their root causes and remediate devices. It provides visibility across all environments and proactively identifies employee experience issues.
Nexthink Infinity is a comprehensive DEX tool that makes it possible for IT teams to remediate over a million workspaces. The platform focuses on three key areas in detecting, diagnosing and remediating potential issues:
Real-time alerting. Preemptively identifies employee experience issues. Administrators can customize alerts based on different aspects of the digital experience. Designated team members receive real-time notifications for urgent issues.
Diagnostics and analytics. Performs AI-based root cause analysis of each issue, assessing DEX telemetry in real time. The platform captures data at the event level to deliver visibility into devices, applications and networks while automatically assessing the scope and impact on employees.
Automation and remediation. Automates and resolves issues in the background while providing an extensive catalog of one-click automated actions, along with support for customized remediation scripts. Administrators can also provide employees with targeted self-help information and troubleshooting to reduce support overhead.
Other features include support for real-time alerting, accelerated troubleshooting through pattern recognition and tools such as Experience Central, an algorithm and digital experience scoring system.
Raygun
Raygun is a suite of monitoring tools that provide visibility into the quality and performance of web and mobile apps. The platform includes three primary tools: Application Performance Monitoring, Crash Reporting and Real User Monitoring. With Raygun, IT teams can gather detailed information about how users are accessing applications, how the applications are performing and what issues users might be running into. Administrators can also triage support requests and drill down into error or performance details.
The Real User Monitoring product provides insights into front-end performance issues that can impact mobile or web users. Administrators can look into slow pages, diagnose issues at the instance level or view a waterfall breakdown of load times across components. The tool also comes with language support for React, Angular, JavaScript, Xamarin, iOS and Android.
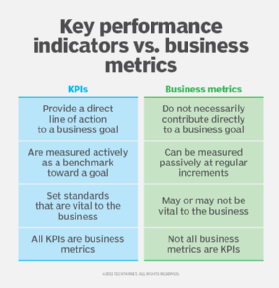
Organizations can monitor and compare KPIs and other business metrics with EUEM tools.
Raygun's Real User Monitoring tool targets three basic use cases:
Trend monitoring. Measures trends in application performance by tracking specific metrics such as page views, virtual pages or XMLHttpRequest network calls.
Performance issue diagnosis. Identifies and diagnoses performance issues and their root causes.
User experience analysis. Retraces user sessions, verifies performance at the request level and views how users interact with the application.
Raygun provides a centralized interface for monitoring the application environment. Administrators can create project or team dashboards that offer immediate visibility into their environments, with real-time updates based on performance KPIs and service-level agreements (SLAs). Raygun also integrates with a range of third-party applications and complies with multiple protection regulations, including GDPR and HIPAA.
Riverbed Alluvio Aternity
Alluvio Aternity is a digital experience management platform that provides actionable user experience insights while helping to predict and prevent business disruptions. The platform collects and stores technical telemetry from a wide range of devices and applications, including cloud-native services. To facilitate data collection, admins must install the Aternity agent on application infrastructure and end-user devices, where it can measure what the user actually sees.
Alluvio Aternity combines IT service benchmarking, device performance monitoring, APM and EUEM into a single platform. It can collect user experience information from any application or device, making it possible to diagnose issues at the application, device or network level. The platform offers four key EUEM-specific functions:
Automatic discovery. Discovers applications, tracks their usage and scores their performance and effectiveness based on events such as errors, crashes, wait times and page load times.
User tracking. Monitors what users actually see when they interact with an application, breaking down response times between the client device, network and application back end.
Change validation. Compares the user experience before and after any type of change to the device, application or infrastructure. Administrators can analyze user experience data before and after a change to ensure that it achieved the desired results. They can also test the impact of their changes on a pilot group.
Self-healing. Enables administrators to create, modify and expand the platform's automation scripts so the most common device and user issues can be resolved automatically.
The change validation utility is especially helpful for minimizing the risks that come with making changes, and IT teams can also analyze trends in an application's adoption across the enterprise. It's also possible to analyze an application's transactions to quantify the financial effect of performance on productivity.
SolarWinds Pingdom
Pingdom is a web application monitoring platform that provides insights into application health and performance. It is one of the products in the SolarWinds APM suite, although it's been gaining steady recognition as a standalone service. IT teams can use Pingdom to track web applications on premises, in hybrid environments or on cloud platforms such as Azure and AWS.
Pingdom is itself a SaaS web application that provides visibility across multiple environments from a centralized interface. In addition to web applications, IT teams can monitor networks and APIs, correlate web performance with business outcomes and identify historical trends with page speed performance reports.
RUM. Lets administrators view details about the user experience based on browser, device type or geographic location. Admins can also compare usage metrics over time and monitor their sites against critical KPIs and SLAs.
Synthetic monitoring. Lets admins track uptimes, analyze page speeds and monitor transactions that range from simple to complex. It's also possible to use a web recorder to capture how a user interacts with a website, and admins can translate those actions into a script.
Customizable alerts. Enables admins to configure alerts about HTTP status, content changes, error messages and other issues.
The platform can help expedite root cause analysis and generate reports with advanced visualizations that provide insight into the monitored environment. Pingdom also offers webhooks to easily integrate with third-party software such as Slack, HipChat and PagerDuty.