
Nmedia - Fotolia
Using Task Manager to monitor memory usage in Windows 10
With the Windows 10 Task Manager, desktop admins can monitor memory usage across the desktop to identify the source of any performance issues and terminate it.

When desktop administrators troubleshoot a Windows 10 issue, they can start the process by identifying any applications or processes consuming an excessive amount of memory.
With the Windows 10 Task Manager, IT admins can monitor memory usage in real time and note anything suspicious on the desktop. IT professionals should get to know the various utilities the Windows 10 Task Manager offers alongside memory monitoring capabilities.
Memory and performance analysis
IT admins can't always address a lack of desktop resources by adding RAM or expanding the page file. There could be a virus or malfunctioning applications causing a memory leak.
The applications could be consuming CPU resources, which will cause performance degradation. When the system is slow or unresponsive, it is an indication that some process is consuming resources or denying access to other processes. Of course, it could simply be too many applications running at the same time.
Real-time memory monitoring with Task Manager
The Windows 10 Task Manager is simplified from previous versions of Windows and the new UI takes a little getting used to. However, it still provides valuable system information about processes, applications, performance and resource use. There are a several key data sets in the Task Manager that can help in the Windows troubleshooting process.
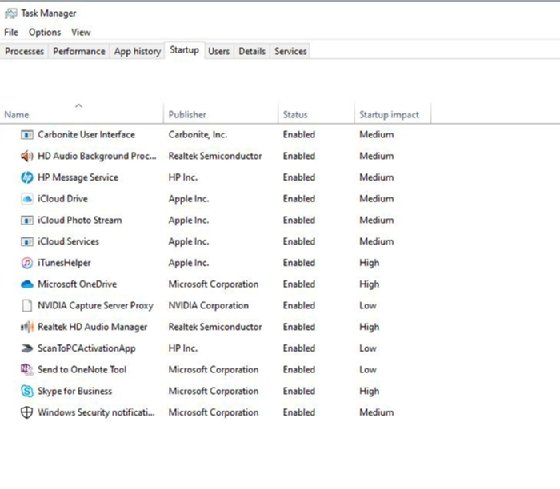
Startup
This table shows the processes Windows has scheduled for startup (Figure 1). This is helpful in identifying high-impact processes. Review this list to ensure all processes are valid, as malware or viruses could be present. Right click on a process to disable it, open the file location, search for it online or view the properties. It's a good idea for IT admins to identify any problematic processes to reduce startup processes and applications and to shorten boot time.
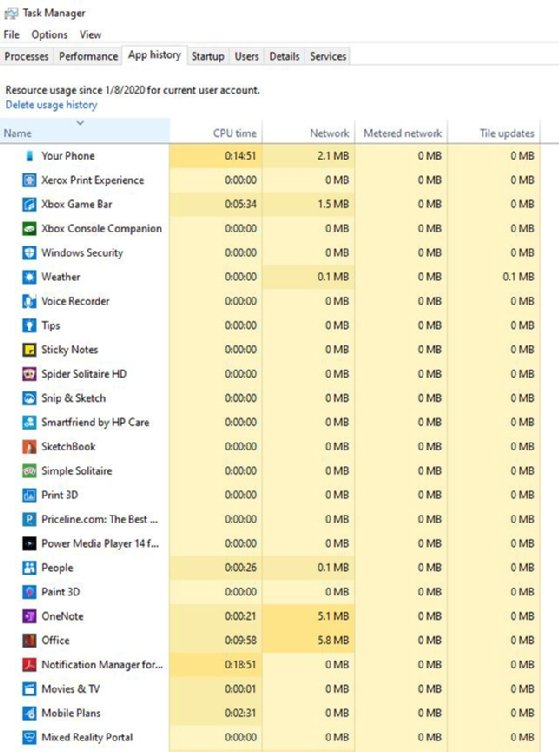
App history
This list shows all the apps the user has opened and interfaced with and their effect on network and CPU time (Figure 2). Review this list for anything that is unknown. Then search the internet to determine what those applications are so you can uninstall them if necessary.
Processes
This data set is a little more granular than App history, as it also lists background processes and Windows processes. CPU, memory, and disk and network resource usage are listed for each process. Click on the column header to see the big hitters on CPU and memory. This example shows the processes sorted by memory usage (Figure 3).
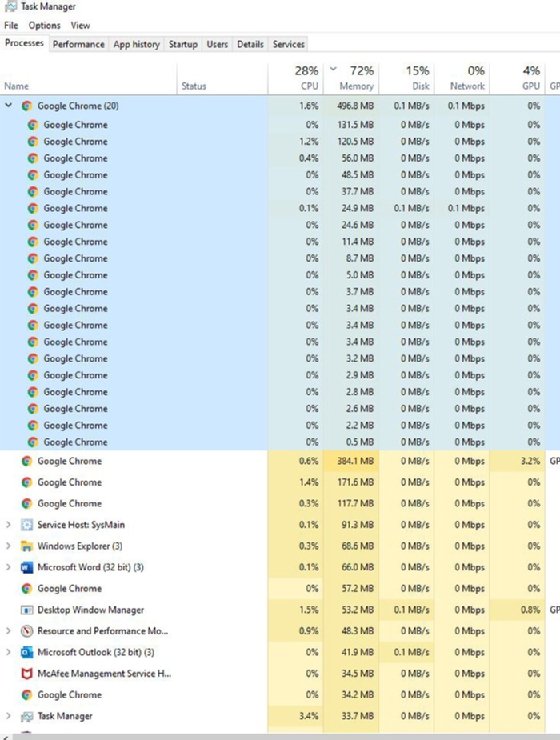
Because Google Chrome was the top memory user, the Chrome line expands to show subprocesses and provide more details on resource use. Close the Chrome browser pages one by one to find the big hitter. Closing other applications when heavy hitters are active will improve performance. This is one improvement specific to the Windows 10 Task Manager.
Services
Any services related to apps and processes are listed in this tab. Click on the Status column header to sort running and stopped processes. Review the names and research any suspicious ones.
Performance
This is the Task Manager's real-time monitor of system resources in a graph format (Figure 4). Clicking on the options in the left pane provides details about CPU, memory, disk and network resources. In this tab, it's easy to see memory usage and composition.
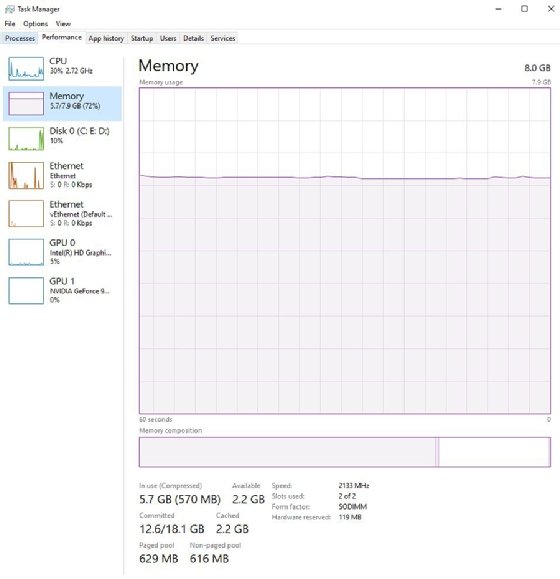
In this example, the system is using 5.7 GB of 7.9 GB of RAM or approximately 72%, which indicates that adding memory would be a good option. For a more detailed analysis of the memory resources, click on 'Open Resource Monitor' at the bottom of the Performance page. This provides the following detailed memory layout (Figure 5):
- 5,786 MB of memory in use: This shows that applications are actively using memory.
- 36 MB of memory modified: The data the desktop must write to disk.
- Standby memory: The old data the desktop can use again.
- Free memory: This area contains no data; the desktop will use this memory first as the desktop needs more resources.
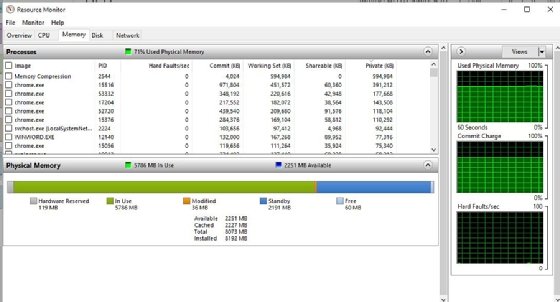
These numbers give desktop admins a sense of how much memory is actively in use. The Resource Monitor shows in-depth data for CPU, disk and network as well.
Windows 10 compressed memory
Windows 10 has introduced a feature with build 10525 in 2015 called compressed memory. Like a compressed file, this feature compresses memory, which increases available memory for the Windows 10 desktop. When the OS fetches data from that compressed memory, the OS decompresses it for use.
While this involves some overhead memory use, it is still much faster than paging data to and from the page file on a hard disk. If there is plenty of RAM to handle applications, the OS won't use memory compression. Compressed memory is enabled by default, but desktop admins can disable and enable it by executing a PowerShell command. Type PowerShell in the Windows Search box to open PowerShell window and then execute the following command:
>Enable -MMAgent -mc
>Disable -MMAgent -mc
There is a way to perform this task via the registry editor -- Regedit or Regedit32 -- but editing the registry is very high risk, so that method is not recommended.